
Search articles

Type a keyword to start searching
Back to selected work
Case 012017—2026

Financial visualization infrastructure

DataV · HiVis · Standard Chart

A financial chart library our team have maintained over several years. Products share charts and interactions while using their own frontend frameworks.

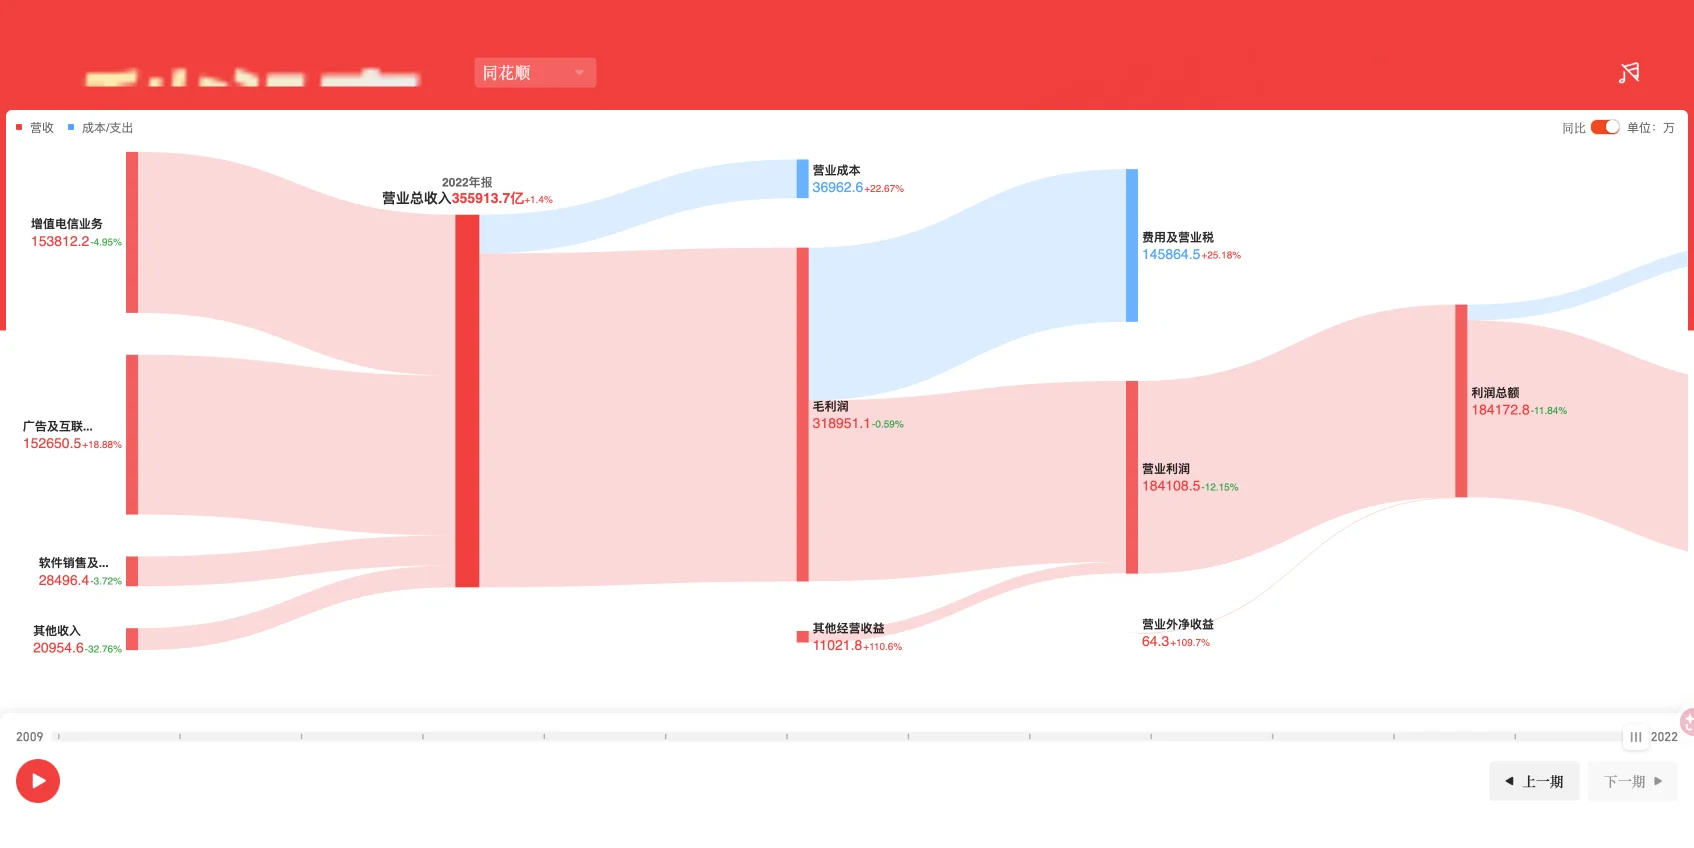
Standard Chart Sankey output
Platform engineering / Data visualization2017—2026
Changing products or frontend frameworks should not mean rewriting the charts.
9 yrs
years of development
4 engines
chart engines
3+ frameworks
frontend frameworks

A SMALL EXPLORATION

Same data. A different reading.

Sorting makes comparison easier. Labels make values available without hovering. Try both.

Fixed sample data, not financial data or live AI output. This illustrates design choices without running a model.

Change the presentation. Keep the data.

PROJECT EXAMPLES

Screenshots and examples

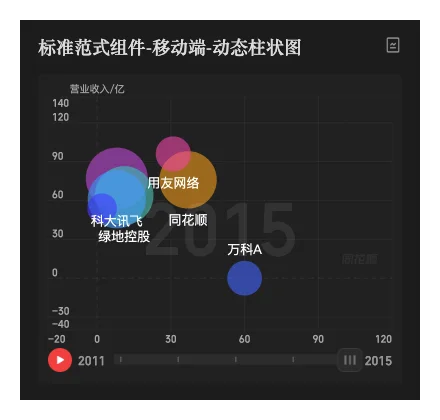
Standard Chart animated bubble scatterplot

Animated bubble scatterplot

A mobile financial bubble chart with timeline, labels, and animated data updates.

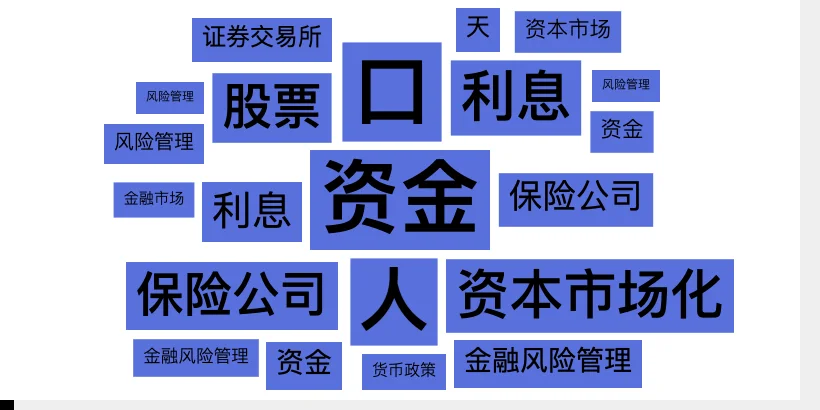
Standard Chart financial word cloud

Financial word cloud

Frequency and weight encoding over financial terms, captured from the real component demo.

Standard Chart word stream

Word stream

Continuous streams show how the strength and structure of industry themes change over time.

Standard Chart animated financial Sankey diagram

Animated financial Sankey

Revenue, cost, and profit are organized into a year-by-year animated flow.

01 / Context

The problem

Products used different frameworks, chart engines, and data formats. Copying a component also copied its original theme, interactions, and data assumptions, all of which needed reworking.

What we built

Standard Chart and HiVis collect that shared work into a library. Web Components support integration across frameworks, charts interact within cards, and generated configurations are checked before rendering.

02 / System

How the system works

  1. 01

    Contract layer

    Unified data, configuration, events, themes, and lifecycle across products and chart engines.

  2. 02

    Composition layer

    Charts can interact within a card, while separate cards stay independent. This gives us a smaller area to investigate when an interaction breaks.

  3. 03

    Delivery layer

    Stencil compiled to native Web Components with React, Vue, and Angular wrappers, plus lazy delivery for components and AI charts.

03 / Decisions

Design choices

01

Keep events within a card

Scoped interaction events to a card, preventing implicit global dependencies in complex financial pages.

02

Separate primitives from business widgets

Axes, legends, and other shared parts live in base components. Specialized behavior gets its own component so one chart does not accumulate too many options.

03

Check generated configurations

AI output entered rendering only after structural validation, adaptation, and fallback handling.

04 / Our work

Our role

Role:We led the project and its technical design, and built core modules. Our work focused on component interfaces, framework integration, and releases.

  • 01Designed the cross-framework component architecture and planned later revisions
  • 02Designed component interfaces, communication within cards, themes, and engine adapters
  • 03Built core modules, investigated difficult bugs, and reviewed integrations
Web ComponentsTypeScriptStencilEChartsD3.js
Open public project