
Financial charts and data stories
From financial charts to data stories: turn data into something people can understand and use.
Visualization and AI ↗
LEO ZHOU / CHANGJU ZHOU
Data Visualization Lead · Hithink RoyalFlush AI
15 years in financial visualization. Core architect of HiVis. Now building verifiable visualization agents and harnesses that help agents get things right.
WRITING AS DATA
330 ESSAYS01 / FOCUS
From financial charts to data stories: turn data into something people can understand and use.
Visualization and AI ↗Check structure, meaning, and rendering. Put evaluation and feedback inside the agent workflow.
Agent engineering ↗02 / SELECTED WORK
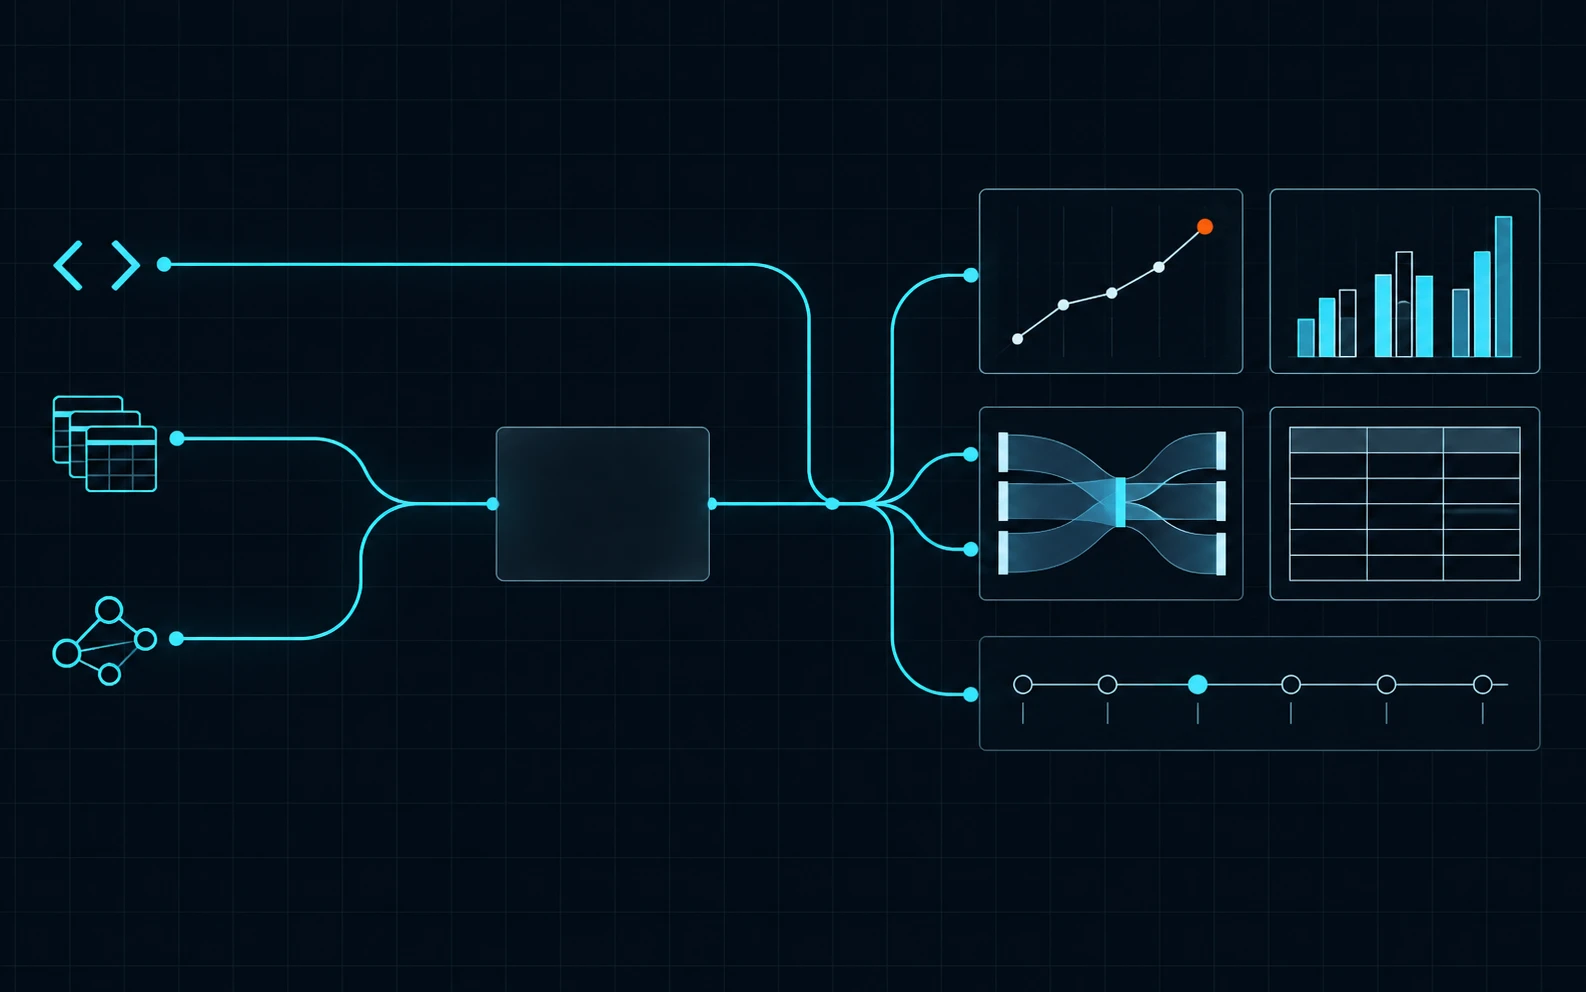
01 / Viz Platform
I set the direction, architecture, and protocol; development runs on the AI workflow. Illustration, not a product screenshot.
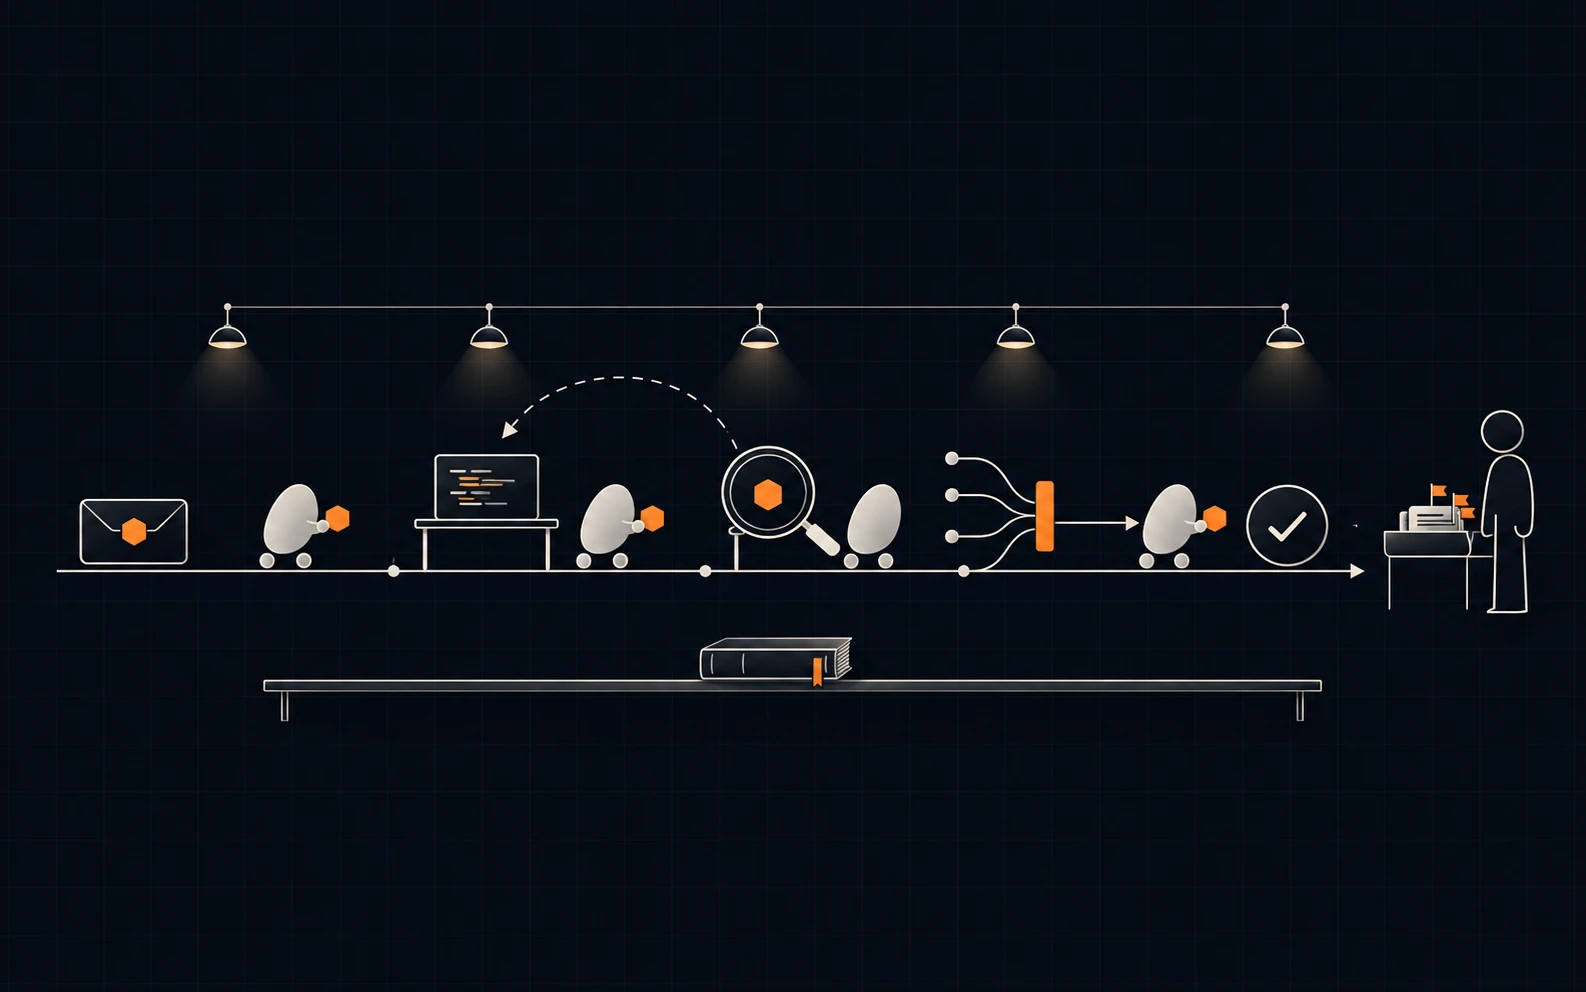
02 / AI Workflow
I designed and maintain the workflow, and Viz Platform is built with it. Illustration, not a product screenshot.

03 / Narrative Visualization
Our team led project design, Narrative DSL, and media timing. Cover: earlier team research, 2024; current system output pending.
03 / WRITING
01 / 2026-05-28
How AI changes engineering work from writing every line to designing context, tools, constraints, and evaluation loops.
3 MIN READ02 / 2026-05-18
A practical method for turning vague improvement goals into measurable feedback loops for both people and AI agents.
3 MIN READ03 / 2026-05-25
Why reliable AI-assisted engineering depends on observable feedback loops, executable checks, and continuously improved context.
3 MIN READSTAY IN THE LOOP
Subscribe in your RSS reader. No email address needed.
04 / RESEARCH & RECOGNITION
05 / NOW
Build something meaningful