

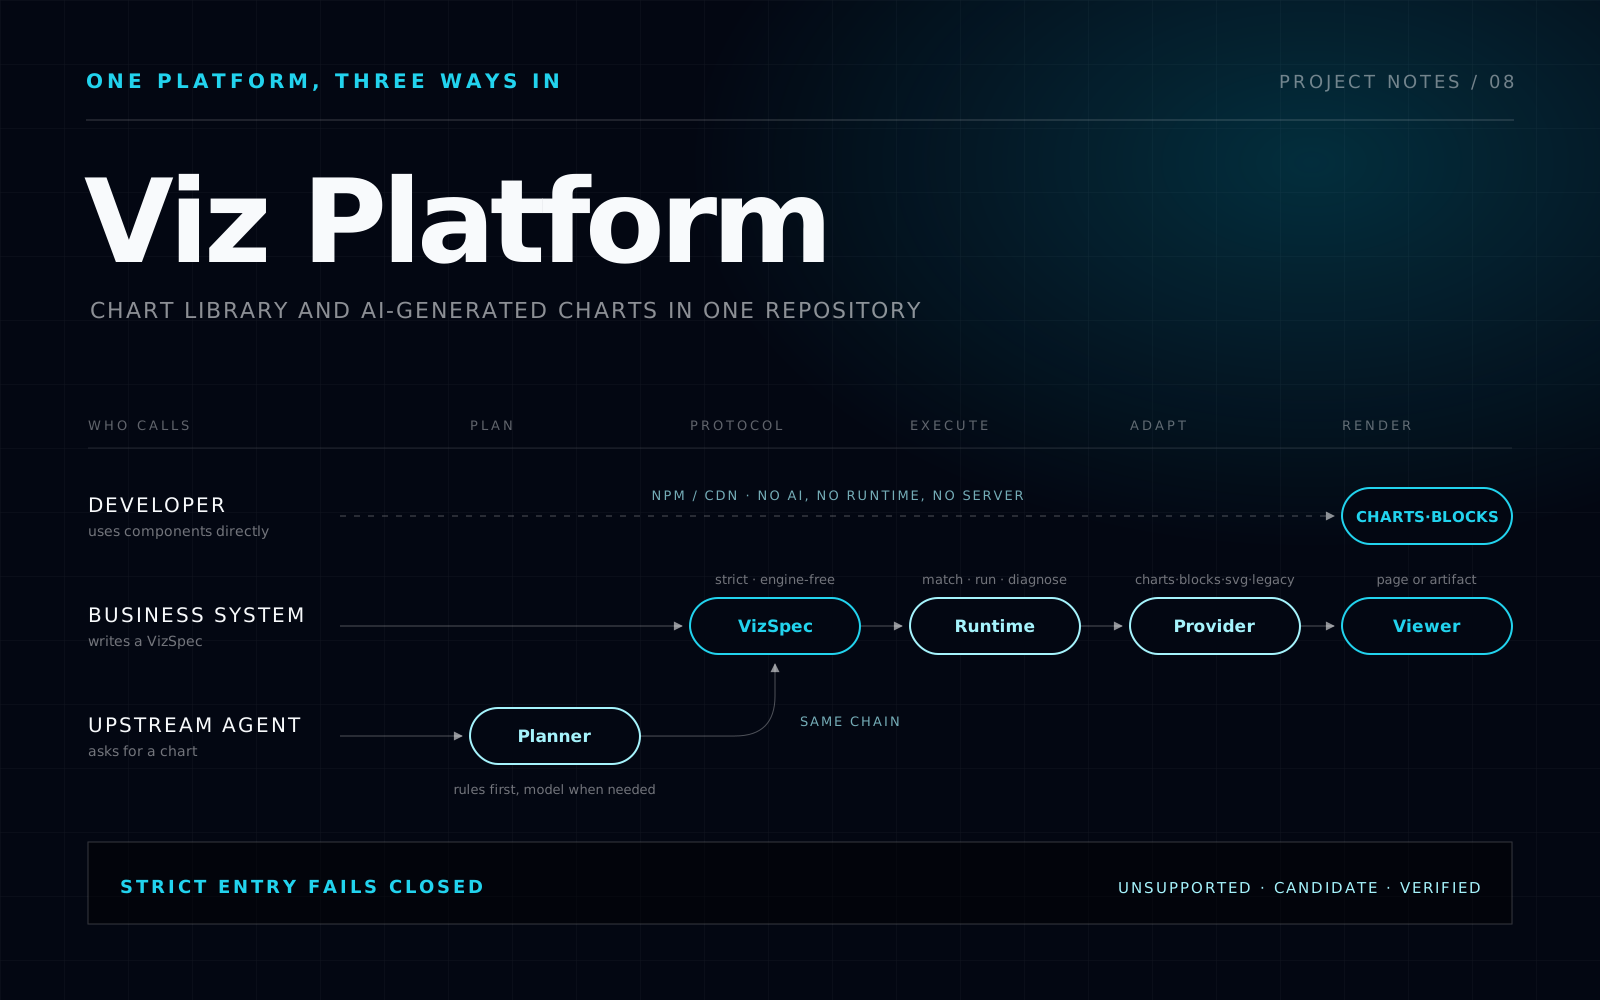
In the old renderer, protocol, composition, and concrete chart layers were mixed together. A failed validation could still go on to render, and the data cache fingerprinted only sampled values, so a change in the middle of a dataset could go unnoticed. Products also used the chart library directly, so it could not be rewritten from scratch; existing charts, themes, interactions, and lifecycles had to keep working.
What I built
The repository now has the chart and Blocks packages, a compatibility entry for the old interface, several providers, the runtime and viewer, a documentation site, and demo pages. Charts and Blocks work on their own through NPM or a CDN, without AI or a server. Full acceptance of the component documentation and the combined release is not finished, so the platform as a whole is not delivered yet.